One of the things you should do to figure out how your hard disk or network drive is organized is to make a list of all of the various file types on the disk and organize that list by file size. This gives you an instant view of what’s taking up the most space on your disk.
While there are many tools available that can do this, CKnow still likes to use the free program WinDirStat because of its speed and excellent graphical representation of the various file types on a hard disk.
It’s an older program that has not been significantly updated in features but it has been updated to keep up with the various versions of Windows. CKnow has not tested it on Windows 7 and the WinDirStat Web site does not mention Windows 7 but it should work fine and, if not, could be run in compatibility mode back to Windows Vista or even XP if needed. [Added: Tested on Windows 7 in February 2013 and it ran just fine on a 3T drive.]
You get the program from the WinDirStat website![]() which is hosted at SourceForge.
which is hosted at SourceForge.
Run the installer and then start the program. When you do, a selection box will pop up and you pick the drive(s) you wish to analyze. Having done that click on the OK button (at the top of the box, not the bottom where you’d usually find one) and the program runs through the various folders on the disk(s) you selected. While doing so, a clever little animation shows you the progress (you can turn this off in the options if you don’t like clever little animations)…
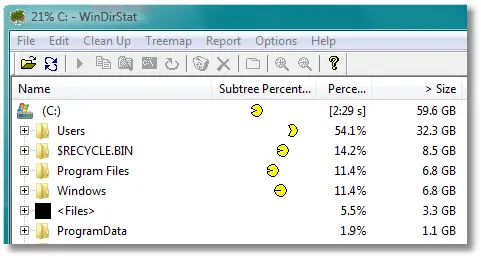
The magic, however, is in the display after the analysis is done…
In the top left you’ll see a directory tree very much like any other directory tree. You can navigate through the various folders using that if you wish. More importantly however, note that this directory tree shows you exactly what percentage of the total used space on the disk is used by that folder and any folders under it. This gives you a much more useful look at the directory tree than Windows itself gives you.
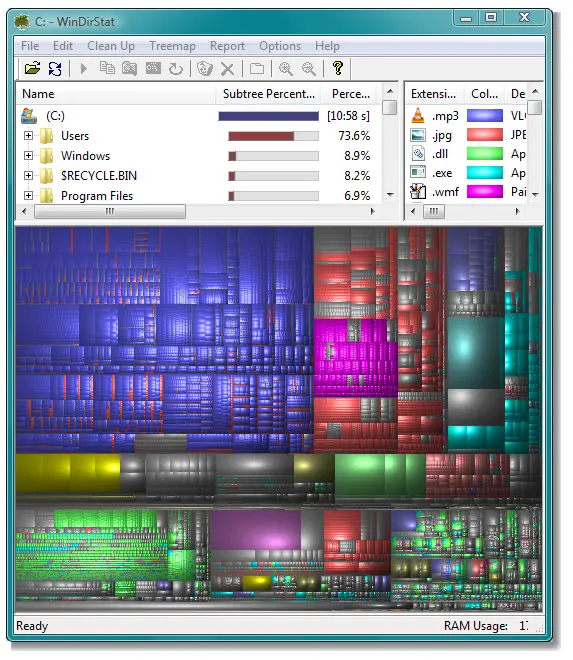
Now, look to the right. This is a particularly helpful display. It shows the various file types on your system and, while it’s not shown above, the percentage of the used hard disk space that this file type takes up on the disk. It will also tell you the total space on the disk used by those file types and how many different files take up this space.
The fun part of the program is in the graphic display of this file type information. The graphic represents the entire hard disk(s) analyzed. Each file type is represented in this diagram by a color so as you look at the various colors you can see where the file type(s) are on the disk in relation to all of the files on the disk. Moreover, each very small square in the diagram represents a single file and these squares are then grouped into larger squares and those again into ever larger squares and so on. Each of these larger squares is a subdirectory. So, the entire diagram is the disk, each very large square is a folder off the root of the drive and then each smaller square inside each of these is another subdirectory under the folder above. This continues down the the smallest square which represents a file.
Click on a square in the colored area and the explorer display in the upper left will indicate the file that the square represents and the file type display will highlight the particular file type of that file.
For those who think this display looks familiar, it is based on the KDE program KDirStat![]() .
.
The program has a number of options to change the display but the default is quite enough for most users.